A moving average is one of the most commonly used tools in technical analysis, providing traders with a clear visual representation of a market’s direction over a specified period. So, what is a moving average? In simple terms, it’s a calculation that helps smooth out price data to identify the overall trend by reducing the “noise” from random short-term fluctuations. By tracking the average price of an asset over time, moving averages allow traders to spot trends more easily and make informed decisions.
Moving averages can be applied across various timeframes and are commonly used with other technical indicators. This makes them a versatile tool for both short-term day traders and long-term investors. Whether using a simple moving average (SMA) or an exponential moving average (EMA), understanding how these averages function and how they interact with the price action is key to developing a robust trading strategy. By leveraging moving averages, traders can more effectively determine market momentum, identify potential reversals, and manage risk.
Table of Contents
How Does a Moving Average Work in Financial Markets?
A moving average plays an integral role in financial markets by smoothing price data over a set period, allowing traders to see trends without the daily volatility. It calculates the average price of an asset, such as a stock or commodity, over a defined period, such as 10, 50, or 200 days. The moving average “moves” as new data replaces the oldest data in the series. The result is a line that helps to gauge the overall direction of the market.
Traders use the moving average to determine market momentum. For example, when the price of an asset crosses above the moving average, it is generally viewed as a bullish signal, indicating a potential upward trend. Conversely, when the price crosses below the moving average, it can signal a bearish trend, implying potential price declines. These shifts are used to identify support and resistance levels and help in decision-making regarding buying or selling assets.
Key Functions in Financial Markets:
- Helps to smooth out price fluctuations and noise.
- Used for identifying trends (upward or downward).
- Acts as a dynamic support and resistance level.
What Are the Different Types of Moving Averages?
There are several types of moving averages, each serving a different purpose depending on the needs of the trader or analyst. The three most common types are the Simple Moving Average (SMA), Exponential Moving Average (EMA), and Weighted Moving Average (WMA).
- Simple Moving-Average (SMA): The SMA calculates the average of a set number of data points by giving equal weight to each point. It’s one of the easiest to calculate and is commonly used for analyzing trends over longer time frames. However, it may be slower to react to recent price changes due to its equal weightage.
- Exponential Moving-Average (EMA): The EMA gives more weight to recent data points, making it more responsive to current market conditions. Traders often prefer the EMA for short-term trading strategies, as it reacts more quickly to price changes compared to the SMA.
- Weighted Moving-Average (WMA): The WMA assigns greater importance to the most recent data, even more than the EMA, which makes it more sensitive to recent market moves. It’s commonly used when traders want to react quickly to the latest price fluctuations.
Comparison of Moving Averages:
- SMA: Slow to react, good for long-term trends.
- EMA: Faster reaction to price changes, good for short-term trading.
- WMA: Very responsive, highly sensitive to recent data.
What Is the Significance of a Simple Moving Average (SMA)?
The Simple Moving Average (SMA) is a foundational tool in technical analysis. It is calculated by adding up the prices over a specific period and then dividing by the number of periods. Traders and investors use the SMA to evaluate the overall direction of the market over a specific timeframe, such as 50, 100, or 200 days, providing a longer-term view of the market’s behavior.
The SMA is significant because it smooths out short-term volatility and reveals the underlying trend. It is particularly helpful in spotting trend reversals. For example, a 200-day SMA is often used as a critical indicator of the health of the stock market. When the price is above the SMA, it suggests that the market is in an uptrend, while prices below the SMA can indicate a potential downtrend.
Key Uses of SMA:
- Trend identification: Distinguishes long-term market direction.
- Signal generation: When the price crosses the SMA, it may indicate potential buy or sell signals.
- Smoothing: Removes noise from short-term fluctuations to focus on the larger market movement.
How Does the Exponential Moving Average (EMA) Differ from SMA?
The Exponential Moving Average (EMA) and Simple-Moving-Average (SMA) both smooth price data to help traders identify trends, but they differ in how they treat the data. The key distinction lies in how they give weight to data points. While the SMA assigns equal weight to all data points in the selected period, the EMA gives more weight to recent prices, making it more responsive to recent price changes.
For short-term traders, the EMA is often preferred because its quick responsiveness can help catch emerging trends earlier than the SMA. This makes the EMA particularly useful in fast-moving markets like cryptocurrency trading or forex. On the other hand, the SMA is more suited for long-term analysis, where traders are less concerned with recent fluctuations and more interested in the overall direction of the market.
Key Differences Between EMA and SMA:
- Responsiveness: EMA reacts more quickly to recent price changes, while SMA is slower.
- Use cases: EMA is better suited for short-term trading strategies, while SMA is ideal for long-term trends.
- Weighting: EMA assigns more weight to the latest data, while SMA gives equal weight to all data points.
What Are the Common Timeframes Used for Moving Averages?
Different timeframes are used for moving averages depending on the type of trading or analysis being conducted. For short-term traders, popular timeframes include the 10-day, 20-day, and 50-day moving-averages, which help identify short-term trends. These shorter periods are more sensitive to market movements and can help traders make quick decisions about entry and exit points.
For longer-term investors, the 100-day and 200-day moving the averages are more commonly used. These timeframes help smooth out day-to-day volatility and reveal the broader direction of the market. The 200-day moving-average is especially significant in stock market analysis, often serving as a major support or resistance level. When an asset’s price moves above its 200-day moving-average, it’s often seen as a bullish signal, while a move below can indicate a potential downturn.
Common Timeframes for Moving-Averages:
- 10-day and 20-day: Used by short-term traders for quick trend identification.
- 50-day: A middle ground for medium-term trading strategies.
- 100-day and 200-day: Long-term indicators, often used by investors to assess overall market health.
How Do Traders Use Moving Averages to Identify Trends?
Traders rely on moving-averages to identify trends by smoothing price data and making it easier to observe the overall direction of the market. By plotting the average on a price chart, traders can spot whether an asset is in an uptrend, downtrend, or trading sideways. The slope of this average provides a clear visual of the market’s direction. When this average is sloping upwards, it indicates that prices are generally rising, signaling a potential buying opportunity. Conversely, a downward-sloping average suggests that prices are falling, which could indicate a good time to sell.
Another common method traders use is moving average crossovers. This occurs when a shorter-period average (e.g., 50-day) crosses above or below a longer-period moving-average (e.g., 200-day). A bullish crossover (known as the “golden cross”) happens when the shorter moving_average rises above the longer one, signaling a potential upward trend. A bearish crossover (or “death cross”) occurs when the shorter moving-average falls below the longer one, indicating a potential downward trend.
How Moving Averages Help Identify Trends:
- Slope analysis: An upward or downward slope of the moving-average indicates the overall direction of the market.
- Crossover strategy: Short-term and long-term moving-averages crossing can signal potential buying or selling points.
- Trend confirmation: Moving-averages can confirm ongoing trends or signal potential reversals.
What Are the Advantages of Using Moving Averages in Analysis?
Moving averages offer several advantages when used in technical analysis. One of the most notable benefits is their ability to smooth out price data, reducing the impact of short-term fluctuations and making it easier for traders to focus on the overall trend. This helps traders avoid reacting to daily price noise, allowing for more informed decision-making based on long-term trends.
Another advantage is their simplicity. Moving averages are easy to calculate and interpret, making them accessible even for beginner traders. By offering a visual representation of the trend, these averages enable traders to spot potential trend reversals or confirm the current market direction without relying on complex indicators. Additionally, these averages are widely used in strategies like average crossovers and momentum trading, making them versatile in various trading environments.
Advantages of Moving Averages:
- Simplicity: Easy to calculate and understand.
- Noise reduction: Smoothens out short-term volatility.
- Trend identification: Helps confirm or spot trend reversals.
What Are the Limitations of Moving Averages in Predicting Market Behavior?
Despite their widespread use, moving averages have several limitations. One major drawback is the fact that they are lagging indicators, meaning they reflect past data rather than predicting future price movements. Because of these averages may delay signals, which can cause traders to enter or exit positions late. This lag can be especially problematic in volatile markets, where prices can change rapidly.
Another limitation is that moving averages perform poorly during sideways or range-bound markets. In such conditions, these averages may produce false signals, leading traders to make incorrect decisions. For instance, in a sideways market, prices fluctuate in a narrow range, and movings averages can cross frequently, falsely indicating trend reversals. Traders must combine these averages with other indicators, such as relative strength index (RSI) or Bollinger Bands, to minimize the risk of false signals.
Limitations of Moving Averages:
- Lagging indicator: Reflects past data and may delay signals.
- Poor performance in sideways markets: Can result in false signals.
- False breakouts: Risk of entering or exiting positions too late.
How Is a Moving Average Used to Create Trading Signals?
Moving averages are a crucial component of many trading systems because they generate actionable signals that traders can use to make buying and selling decisions. The most common strategy is the average crossover, where traders monitor the interaction between a short-term average (e.g., 50-day) and a long-term average (e.g., 200-day). When the short-term average crosses above the long-term average, it is considered a bullish signal, often referred to as the golden cross, indicating a potential upward trend. Conversely, a bearish signal or death cross occurs when the short-term average crosses below the long-term average, signaling a potential downward trend.
Another widely used strategy involves using a moving average as dynamic support or resistance. In this case, the average line acts as a barrier that the price tends to respect. When the price approaches the average line from below and bounces off, it can act as support, signaling a potential buying opportunity. If the price moves downwards and breaks below the average, it can act as resistance, signaling a potential sell signal.
How Moving Averages Create Trading Signals:
- Crossover strategy: Golden cross and death cross signals.
- Dynamic support/resistance: Acts as barriers that price levels respect.
- Trend confirmation: Helps confirm buy or sell signals based on price movements.
What Is the Role of Moving Averages in Crossover Strategies?
Moving average crossover strategies are among the most popular techniques in technical analysis. This strategy involves using two different averages: a short-term one and a long-term one. The crossover between these two averages provides traders with signals to buy or sell an asset. The most well-known crossovers are the golden cross and the death cross.
A golden cross occurs when a short-term moving average, such as the 50-day average, crosses above a long-term average like the 200-day average. This event is considered a bullish signal, indicating a potential upward trend. On the other hand, a death cross happens when the short-term average crosses below the long-term average, signaling a bearish market. These crossover strategies are widely used because they provide clear, actionable signals, though they are more effective in trending markets rather than range-bound markets.
Key Aspects of Crossover Strategies:
- Golden cross: A bullish signal when the short-term average crosses above the long-term average.
- Death cross: A bearish signal when the short-term average crosses below the long-term average.
- Best used in trending markets: Less effective in sideways or range-bound conditions.
How Do Moving Averages Help in Smoothing Price Data?
One of the primary functions of these averages is to smooth out price data by eliminating short-term fluctuations and revealing the broader trend. By averaging the prices over a specific period, averages filter out the daily noise and allow traders to focus on the general direction of the market. This makes it easier to identify trends, whether upward, downward, or sideways.
Moving averages smooth price data by reducing the impact of outliers and extreme price movements that could otherwise distort the overall picture. This smoothing effect is particularly useful for long-term investors, as it provides a clearer view of the market’s performance over time. In fast-moving or volatile markets, short-term averages (e.g., 10-day or 20-day) can help traders identify quick changes in trend, while long-term averages (e.g., 100-day or 200-day) offer a more stable picture of the market’s health.
Advantages of Smoothing Price Data:
- Noise reduction: Eliminates the effects of daily volatility.
- Trend identification: Helps in determining long-term and short-term market trends.
- Outlier management: Reduces the impact of extreme price movements.
What Tools Can You Use to Calculate and Analyze Moving Averages?
Several tools and platforms are available to help traders calculate and analyze moving averages. One of the most widely used tools is trading platforms like MetaTrader, TradingView, and ThinkorSwim, which offer built-in average indicators. These platforms allow traders to customize the averages based on their desired timeframes and apply them directly to price charts for real-time analysis.
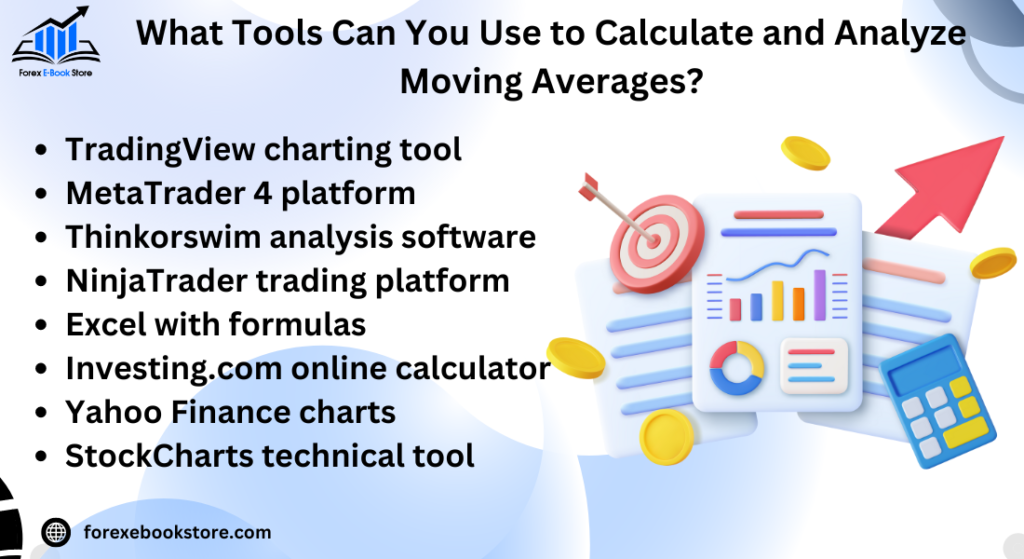
In addition to trading platforms, there are stock market screeners such as Finviz and Yahoo Finance that provide its overlays on stock charts. These tools enable users to filter stocks based on specific criteria, such as crossing above or below averages, which helps identify potential trading opportunities. Moreover, financial tools like Excel or Google Sheets can also be used to manually calculate these averages for more in-depth analysis and backtesting.
Popular Tools for Analyzing Moving Averages:
- MetaTrader, TradingView, ThinkorSwim: Trading platforms with built-in indicators.
- Finviz, Yahoo Finance: Stock screeners with thses overlays.
- Excel, Google Sheets: Manual calculation and back testing tools.
How Are Moving Averages Used in Conjunction with Other Technical Indicators?
Moving averages are often combined with other technical indicators to improve the accuracy of trading signals. One common pairing is with the Relative Strength Index (RSI), which measures the speed and change of price movements. By combining these averages with the RSI, traders can confirm signals. For example, if this average suggests an uptrend, and the RSI indicates that the asset is not overbought, it can confirm a stronger buy signal.
Another popular indicator used alongside it is the Bollinger Bands. Bollinger Bands consist of an average and two standard deviation lines. When prices move near the upper or lower bands, traders use the average to determine whether to enter or exit trades. In such setups, it context to price movement, helping to confirm breakouts or trend continuations.
Moving Averages with Technical Indicators:
- Moving Averages + RSI: Confirms overbought or oversold conditions along with trends.
- Moving Averages + Bollinger Bands: Helps assess volatility and potential breakouts.
- Combining multiple indicators: Reduces false signals and enhances trade accuracy.
What Are the Most Effective Moving Average Combinations for Day Trading?
In day trading, traders often rely on a combination of short-term averages to quickly assess market trends and execute trades within minutes or hours. A common setup is the combination of the 9-period EMA and the 21-period EMA, where traders watch for crossovers to signal potential buy or sell points. The short-term Exponential Moving Averages react quickly to price changes, which is crucial in the fast-paced environment of day trading.
Another effective combination used by day traders is the 5-period EMA paired with the 13-period EMA. This setup is particularly useful for identifying quick market shifts, as the shorter periods provide more immediate signals. In addition, traders may use the VWAP (Volume Weighted Average Price) along with moving averages to get a sense of whether an asset is trading above or below its average price, which can help pinpoint entries and exits.
Effective Moving Average Combinations:
- 9-period EMA and 21-period EMA: Popular for quick signals in day trading.
- 5-period EMA and 13-period EMA: Useful for spotting rapid market changes.
- VWAP + Moving Averages: Helps identify average trading price and confirms trends.
How Do Moving Averages Respond to Market Volatility?
Market volatility can significantly affect the performance of these averages, especially when prices experience sharp fluctuations. Short-term averages like the 10-day SMA or 20-day EMA tend to respond quickly to sudden price changes, which can provide timely signals but also result in false positives during highly volatile periods. In such conditions, these short-term averages may trigger multiple crossovers, leading to indecisive signals.
In contrast, long-term averages like the 200-day SMA are less impacted by short-term volatility. This makes them more reliable for long-term trend analysis, as they filter out noise from price spikes. However, during periods of extreme market volatility, even long-term averages may lag behind, making it difficult to react quickly to significant market shifts. To manage this, traders often combine short-term and long-term averages to balance between responsiveness and stability.
Response to Market Volatility:
- Short-term moving averages: More responsive but prone to false signals.
- Long-term moving averages: Better at filtering out volatility but may lag behind.
- Combination of timeframes: Balances between quick response and avoiding false signals.
What Is the Best Moving Average to Use for Long-Term Investments?
For long-term investments, the most commonly used average is the 200-day Simple Moving Average (SMA). This average smooths out daily price fluctuations over a long period, helping investors identify the overall market trend. The 200-day SMA is often regarded as the “gold standard” for identifying the health of an asset. When the price is above the 200-day SMA, the asset is generally considered to be in an uptrend. Conversely, when the price falls below this level, it may signal a downtrend.
Another popular choice for long-term investors is the 100-day SMA, which provides a balance between medium and long-term trend analysis. While it reacts more quickly than the 200-day SMA, it still filters out the majority of daily price fluctuations. Long-term investors use these moving averages to make decisions about entry points, particularly when prices cross above or below these key levels.
Best Moving Averages for Long-Term Investments:
- 200-day SMA: The most reliable for long-term trend identification.
- 100-day SMA: Provides faster signals while still being suited for long-term analysis.
- Crossing above/below the 200-day SMA: Often considered a major buy or sell signal.
How Are Moving Averages Applied to Stocks vs. Cryptocurrencies?
Moving averages can be applied to both stocks and cryptocurrencies, but there are some key differences in how they are used. In stock markets, these averages are typically applied over longer timeframes, such as the 50-day, 100-day, and 200-day SMAs. This is because stocks tend to have more stability and predictable patterns compared to cryptocurrencies. Stock traders often use the 200-day SMA to assess whether a stock is in a long-term uptrend or downtrend.
In contrast, cryptocurrencies are much more volatile, with frequent price swings that can happen within minutes or hours. As a result, shorter-term averages like the 10-day EMA or 20-day EMA are more commonly used in crypto trading. These shorter-term moving-averages allow traders to react quickly to sharp price changes. Additionally, due to the 24/7 nature of the crypto market, traders may use shorter timeframes to track trends in real time.
Differences in Application for Stocks vs. Cryptocurrencies:
- Stocks: Prefer longer-term averages like the 50-day and 200-day SMAs for stable trend analysis.
- Cryptocurrencies: Use shorter-term averages like the 10-day EMA for quick response to high volatility.
- 24/7 trading in crypto: Requires more frequent monitoring and shorter averages.
How Can Moving Averages Be Adjusted for Different Asset Classes?
Moving averages can be tailored to fit the unique characteristics of different asset classes, such as stocks, bonds, commodities, or currencies. For each asset class, the timeframe and type of average may vary based on the market’s volatility and trading patterns. For example, in the bond market, long-term averages like the 100-day SMA may be used, as bond prices tend to move more gradually than stocks or commodities. In contrast, commodities such as oil or gold often require shorter-term averages like the 20-day EMA, as these markets can experience sharp price movements.
Currencies or forex trading typically use the 50-day EMA or 200-day SMA, depending on whether the trader is focused on short-term or long-term trends. Since forex markets are highly liquid and operate 24 hours a day, it must be adjusted to reflect global price movements across different time zones.
Adjusting Moving Averages by Asset Class:
- Bonds: Prefer longer-term averages like the 100-day SMA due to gradual price changes.
- Commodities: Use shorter-term averages such as the 20-day EMA for volatile markets.
- Currencies/Forex: Balance between the 50-day EMA for short-term and 200-day SMA for long-term trends.
How Do Institutions Utilize Moving Averages in Algorithmic Trading?
In algorithmic trading, institutions use these averages as a core component of their trading models. These averages serve as both standalone signals and part of more complex algorithms that execute trades based on predefined conditions. One of the most commonly used strategies is the moving average crossover. When a short-term crosses over a long-term moving average, the algorithm triggers a buy or sell signal, depending on the direction of the crossover.
Moreover, institutions often utilize these averages in combination with other indicators such as RSI or MACD (Moving Average Convergence Divergence) to refine the accuracy of their algorithms. In high-frequency trading, the responsiveness of shorter these averages like the 10-period EMA becomes crucial in executing trades within milliseconds, maximizing profitability from small price movements. These systems are designed to react to price trends, minimizing human intervention and allowing institutions to capitalize on market inefficiencies.
Institutional Use of Moving Averages in Algorithmic Trading:
- Crossover strategies: Automating buy and sell signals based on this average crossovers.
- High-frequency trading: Using short-term this averages for rapid decision-making.
- Combining indicators: Integrating these averages with RSI, MACD, and other tools for higher accuracy.
How Are Moving Averages Applied in Risk Management?
Moving averages play a critical role in risk management, helping traders and investors set appropriate stop-loss levels and position sizing. One common approach is to use this average as a dynamic support or resistance level. For instance, in an uptrend, the 50-day moving average can act as a support level, and traders might place stop-loss orders slightly below this level to protect against potential downward movements. Similarly, in a downtrend, it can serve as resistance, with stop-losses placed just above it.
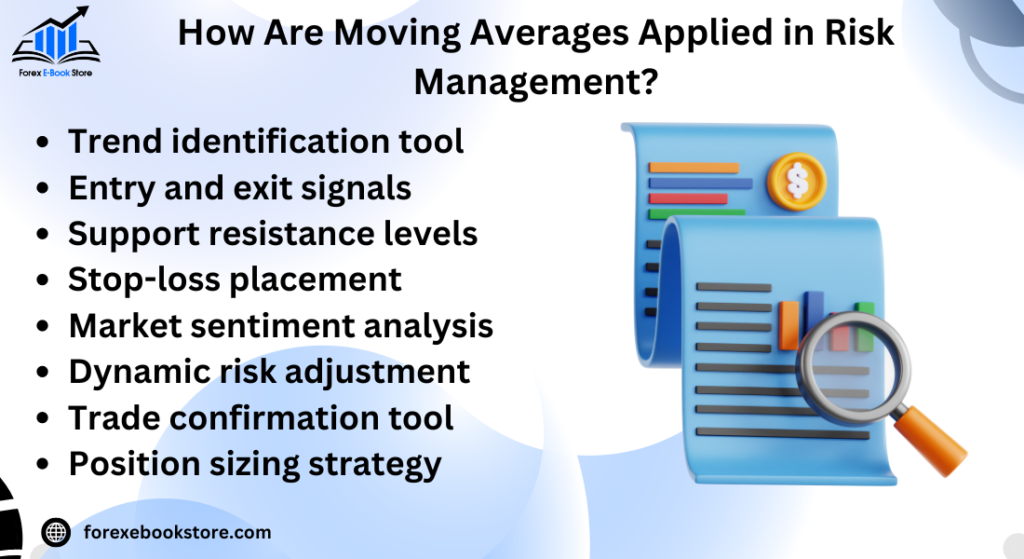
Additionally, moving averages help to determine entry and exit points, reducing the risk of entering a position too early or too late. By waiting for a price to cross above or below a it, traders can better time their trades to minimize losses and maximize gains. In highly volatile markets, traders may use shorter-term it like the 20-day EMA to tighten their risk controls, while longer-term investors may prefer the 200-day SMA for broader risk assessment over time.
Risk Management with Moving Averages:
- Dynamic stop-losses: Placing stop-loss orders around key movings averages to minimize risk.
- Support and resistance: Using movings averages to define critical price levels.
- Risk control in volatile markets: Adjusting movings averages to align with market volatility.
How to Incorporate Moving Averages in Your Investment Strategy?
Incorporating moving averages into your investment strategy depends on your trading goals, time horizon, and risk tolerance. Long-term investors often rely on the 200-day SMA to identify major market trends and make decisions about asset allocation. For instance, if a stock price stays consistently above the 200-day SMA, it may signal a sustained upward trend, making it a suitable candidate for long-term positions. In contrast, if a stock falls below this level, it could indicate a weakening trend, prompting investors to re-evaluate their holdings.
For short-term traders, moving averages like the 10-day EMA and 20-day SMA can be used to identify quick opportunities. By focusing on shorter timeframes, traders can capitalize on short-lived trends or reversals. Additionally, it crossovers can be a vital component of a trading strategy, helping traders decide when to enter or exit a trade based on whether a short-term it crosses above or below a long-term one.
Steps to Incorporate Moving Averages:
- Long-term strategy: Use the 200-day SMA for trend-following and portfolio decisions.
- Short-term strategy: Leverage 10-day EMA for quick trades in volatile markets.
- Crossover strategies: Implement crossover signals to time your market entries and exits.
conclusion
In conclusion, moving averages are essential tools in both short-term trading and long-term investing. By smoothing out price data, it help traders and investors identify trends, reduce noise, and make more informed decisions. Whether using a simple moving average (SMA) or an exponential moving average (EMA), these tools are versatile and can be adapted to various trading strategies. Incorporating movings averages into your investment approach can provide valuable insights into market momentum and trend strength, allowing for better timing in market entries and exits.
Furthermore, understanding support and resistance is crucial when working with moving averages. Moving averages often act as dynamic support and resistance levels, helping traders pinpoint critical price points where reversals or continuations are likely. When combined, moving averages and support and resistance offer a comprehensive approach to technical analysis, allowing traders to manage risk more effectively and improve the accuracy of their trading strategies. By integrating both concepts into your analysis, you can gain a clearer picture of market behavior and make more informed decisions.


