Oscillators are crucial tools for traders, especially in the highly volatile world of Forex trading. These technical indicators help traders identify potential market reversals, overbought and oversold conditions, and trend continuations. Using oscillators in Forex trading allows for a clearer understanding of price momentum and can significantly improve the timing of trades. By analyzing these oscillators, traders can make informed decisions, reducing the risks associated with unpredictable market movements.
In Forex trading, oscillators like the Relative Strength Index (RSI), Stochastic Oscillator, and MACD are popular because they provide valuable insight into market dynamics. When used correctly, these tools help traders capitalize on market trends and reversals by indicating whether an asset is likely to change direction. Mastering the use of oscillators can be a game-changer for both beginner and experienced traders.
Table of Contents
How Do Oscillators Work in Forex Markets?
Oscillators in Forex markets work by helping traders identify price momentum and potential reversals, particularly when the market is in a range-bound condition. They measure the difference between an asset’s recent closing prices and the overall price movements over a certain period. Oscillators are plotted within a range (usually between 0 and 100), where readings indicate whether the market is overbought or oversold.
When the oscillator moves towards the upper end of its range, it indicates that the asset might be overbought and a potential reversal could occur. Conversely, when it moves towards the lower end, it suggests the market could be oversold and a rebound might be imminent. These indicators work best in sideways markets, where price trends are less pronounced, and traders need additional guidance to time their entries and exits.
Key Features of Oscillators in Forex:
- Overbought and oversold signals: Helps identify when the market is at extremes.
- Momentum indicator: Shows the speed and direction of price changes.
- Range-bound markets: Most effective in consolidating or sideways markets.
What Are the Most Popular Oscillators Used in Forex?
Several oscillators are widely used by Forex traders due to their effectiveness in identifying market conditions. Among the most popular are the Relative Strength Index (RSI), the Stochastic Oscillator, and the Moving Average Convergence Divergence (MACD).
- Relative Strength Index (RSI): RSI measures the strength and speed of price movements by comparing recent gains and losses. It ranges from 0 to 100, with readings above 70 indicating an overbought market and below 30 signaling an oversold market.
- Stochastic Oscillator: This oscillator compares an asset’s closing price to its price range over a set period. Like the RSI, it is used to spot overbought and oversold conditions, but it also includes two lines (the %K and %D lines) that offer more detailed signals.
- MACD (Moving Average Convergence Divergence): Although the MACD is technically a trend-following indicator, it also functions as an oscillator, signaling when a new trend may be forming through crossovers of its signal line and MACD line.
Popular Oscillators in Forex:
- RSI: Identifies overbought/oversold conditions.
- Stochastic Oscillator: Signals overbought/oversold with %K and %D lines.
- MACD: Detects trend reversals through line crossovers.
How Can You Use the Relative Strength Index (RSI) in Forex Trading?
The Relative Strength Index (RSI) is one of the most effective oscillators for Forex trading, offering clear insights into market momentum. Traders use the RSI to determine if a currency pair is overbought or oversold, helping them anticipate potential price reversals. When the RSI rises above 70, it indicates that the asset may be overbought, signaling that it could be due for a pullback. Conversely, when the RSI drops below 30, it suggests the asset might be oversold, presenting a potential buying opportunity.
Beyond overbought and oversold signals, the RSI can also be used to spot divergence. Divergence occurs when the RSI moves in the opposite direction of the price trend, which can indicate that the current trend is weakening. For example, if the price is making new highs while the RSI is making lower highs, it may signal an upcoming reversal.
How to Use RSI in Forex:
- Overbought/oversold levels: RSI above 70 or below 30 provides buy or sell signals.
- Divergence: Identifies potential trend reversals when the RSI moves opposite the price.
- Momentum tracking: Helps gauge the strength of a price move.
What Is the Role of the Stochastic Oscillator in Forex?
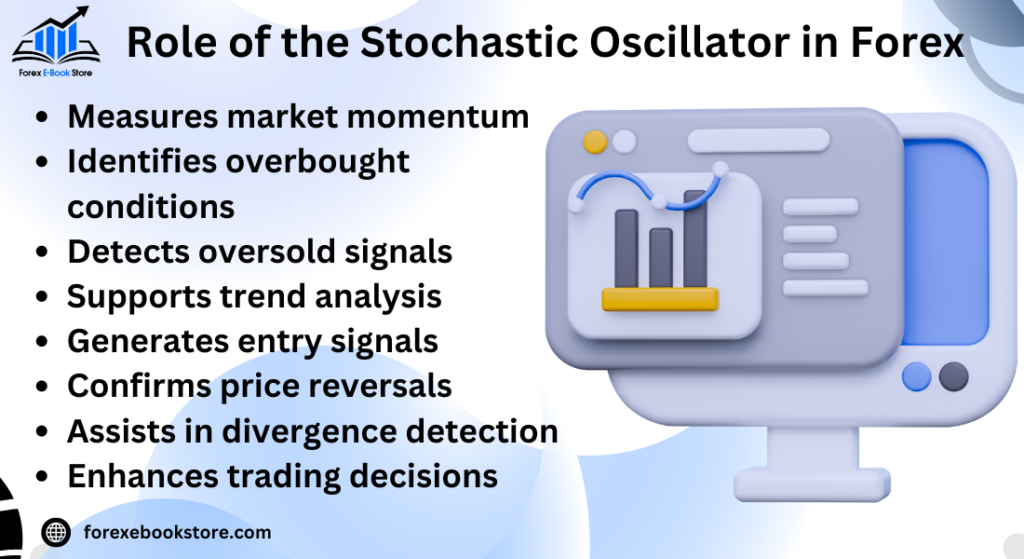
The Stochastic Oscillator is a widely used tool in Forex trading to help identify momentum and potential price reversals. This oscillator compares a currency pair’s current price to its price range over a set period, providing insight into whether the asset is overbought or oversold. It works on the assumption that prices tend to close near the high end of the range during uptrends and near the low end during downtrends.

The oscillator consists of two lines: %K (the main line) and %D (a moving average of the %K line). When the %K line crosses above the %D line and both are below the 20 level, it suggests the market is oversold, signaling a potential buying opportunity. Conversely, when the %K crosses below the %D line and both are above the 80 level, it signals an overbought condition, potentially indicating a sell.
Role of Stochastic Oscillator in Forex:
- Overbought and oversold levels: Above 80 is overbought; below 20 is oversold.
- %K and %D crossovers: Provide buy/sell signals when the lines cross in overbought or oversold zones.
- Momentum indicator: Tracks market momentum, helping traders time entries and exits.
How Can the Moving Average Convergence Divergence (MACD) Help in Forex Trading?
The Moving Average Convergence Divergence (MACD) is a versatile tool in Forex trading that can be used to identify both trends and momentum. The MACD consists of two lines: the MACD line (the difference between the 12-day and 26-day EMAs) and the signal line (a 9-day EMA of the MACD line). When these lines cross, it generates a signal indicating a potential change in trend.
For traders, a bullish signal occurs when the MACD line crosses above the signal line, suggesting that momentum is shifting upwards. On the other hand, a bearish signal occurs when the MACD line crosses below the signal line, signaling that momentum is moving downwards. Additionally, when the MACD histogram moves from negative to positive, it indicates strengthening upward momentum, while a shift from positive to negative suggests weakening momentum.
How MACD Helps in Forex:
- Crossover signals: MACD crossing above or below the signal line indicates potential buy or sell signals.
- Momentum shifts: The MACD histogram shows the strength of market momentum.
- Trend following: Useful for identifying both trends and their strength.
When Should You Use Oscillators in Range-Bound Forex Markets?
Oscillators, such as the RSI and Stochastic Oscillator, are particularly effective in range-bound markets—markets where prices move within a confined range without clear directional trends. In these conditions, oscillators help traders spot overbought and oversold levels, indicating potential reversals within the range. For instance, in a sideways market, the RSI can be used to time entries when it dips below 30 (oversold) and exits when it moves above 70 (overbought).
In range-bound Forex markets, oscillators excel by identifying these turning points, allowing traders to profit from smaller price movements between support and resistance levels. However, it’s essential to combine oscillator signals with other forms of analysis, such as observing candlestick patterns or volume indicators, to avoid false signals that can occur in more volatile conditions.
Using Oscillators in Range-Bound Markets:
- Overbought/oversold signals: Help identify potential reversals within the trading range.
- Support and resistance levels: Use oscillators to time trades between key price levels.
- Best for non-trending markets: Particularly effective in sideways or consolidating markets.
How Do Oscillators Signal Overbought and Oversold Conditions in Forex?
Oscillators are valuable tools in Forex trading for identifying overbought and oversold conditions, which indicate potential turning points in the market. An asset is considered overbought when its price has risen significantly and may be due for a correction. Conversely, it is deemed oversold when its price has fallen sharply and might soon rebound.
For example, the Relative Strength Index (RSI) and Stochastic Oscillator are often used to detect these conditions. The RSI signals an overbought condition when it rises above 70 and an oversold condition when it falls below 30. The Stochastic Oscillator works similarly, indicating overbought conditions when the oscillator value is above 80 and oversold when it’s below 20. These signals help traders time their entries and exits, allowing them to buy low and sell high, or vice versa.
Oscillators and Overbought/Oversold Conditions:
- RSI: Overbought above 70, oversold below 30.
- Stochastic Oscillator: Overbought above 80, oversold below 20.
- Entry and exit timing: Traders use these signals to determine when to enter or exit trades.
What Are the Best Strategies for Using Oscillators in Forex Trading?
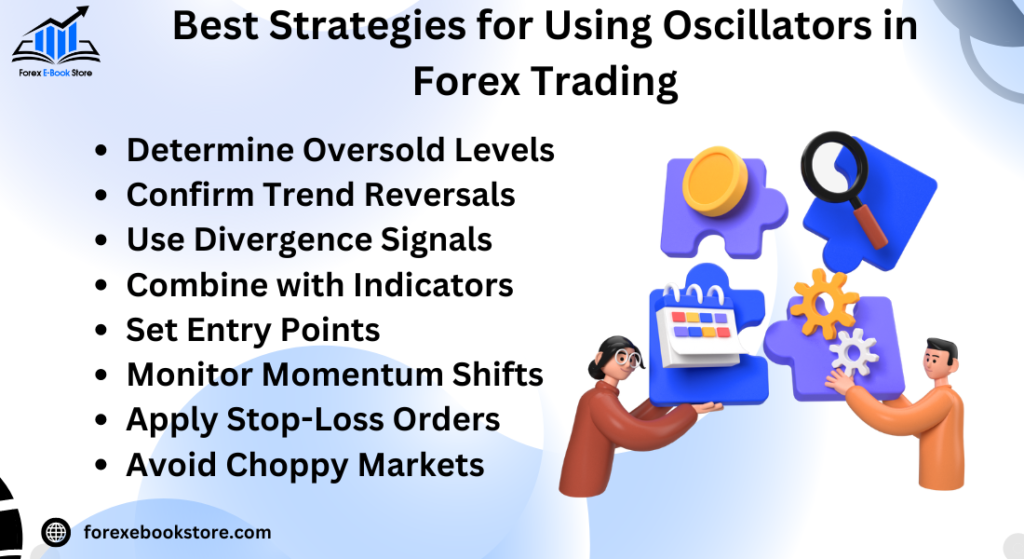
There are several effective strategies for using oscillators in Forex trading, each designed to maximize gains and minimize risk by identifying key market conditions. One of the most popular strategies is the overbought and oversold strategy, where traders wait for the oscillator (such as RSI or Stochastic) to hit extreme levels before placing a trade. For instance, when the RSI falls below 30 (oversold), traders might buy, anticipating a price rebound. Conversely, when the RSI rises above 70 (overbought), they might sell.

Another common approach is the divergence strategy, where traders look for a mismatch between the oscillator and the price. For example, if the price is making higher highs while the oscillator is making lower highs, it indicates bearish divergence, which could signal an upcoming price drop. Similarly, if the price is making lower lows while the oscillator is making higher lows, this suggests bullish divergence and a potential price increase.
Best Oscillator Strategies:
- Overbought/oversold strategy: Buy when oversold, sell when overbought.
- Divergence strategy: Identifies potential reversals through mismatch between price and oscillator.
- Momentum trading: Using oscillators to track the strength of a price move.
How Can You Combine Oscillators with Other Indicators for Better Forex Analysis?
Combining oscillators with other technical indicators is a powerful way to enhance Forex trading analysis and reduce the risk of false signals. For example, traders often pair oscillators like the RSI or MACD with moving averages. When the RSI signals an oversold condition and the price is also approaching a support level identified by a moving average, the trader has multiple points of confirmation, increasing the likelihood of a successful trade.
Another popular combination is using oscillators with trend indicators such as Bollinger Bands or Average True Range (ATR). For instance, when the price breaks through a Bollinger Band and the RSI shows an overbought signal, it could indicate a potential price reversal. By using multiple indicators, traders can filter out false signals and make more confident trading decisions.
Combining Oscillators with Other Indicators:
- Oscillators + Moving Averages: Combine overbought/oversold signals with trend direction.
- Oscillators + Bollinger Bands: Confirm potential reversals with volatility and momentum.
- Multi-indicator strategies: Reduce false signals by using multiple tools for confirmation.
What Are the Limitations of Using Oscillators in Forex Trading?
While oscillators are powerful tools in Forex trading, they come with several limitations that traders need to be aware of. One significant drawback is that oscillators are lagging indicators, meaning they reflect past price movements and may not always be timely. In fast-moving markets, the signals provided by oscillators can be delayed, causing traders to enter or exit trades too late.
Another limitation is their tendency to produce false signals during strong trends. Oscillators are most effective in range-bound markets but can give misleading signals in trending markets. For example, during a strong uptrend, an oscillator like the RSI might signal that a currency pair is overbought, but the price may continue to rise, resulting in a missed opportunity. To counter these limitations, traders often combine oscillators with trend-following indicators like moving averages to filter out unreliable signals.
Limitations of Oscillators in Forex:
- Lagging indicators: Oscillators reflect past price data and may provide delayed signals.
- False signals in strong trends: Can mislead traders during powerful price movements.
- Best suited for range-bound markets: Perform less reliably in trending conditions.
How to Avoid False Signals When Using Oscillators in Forex?
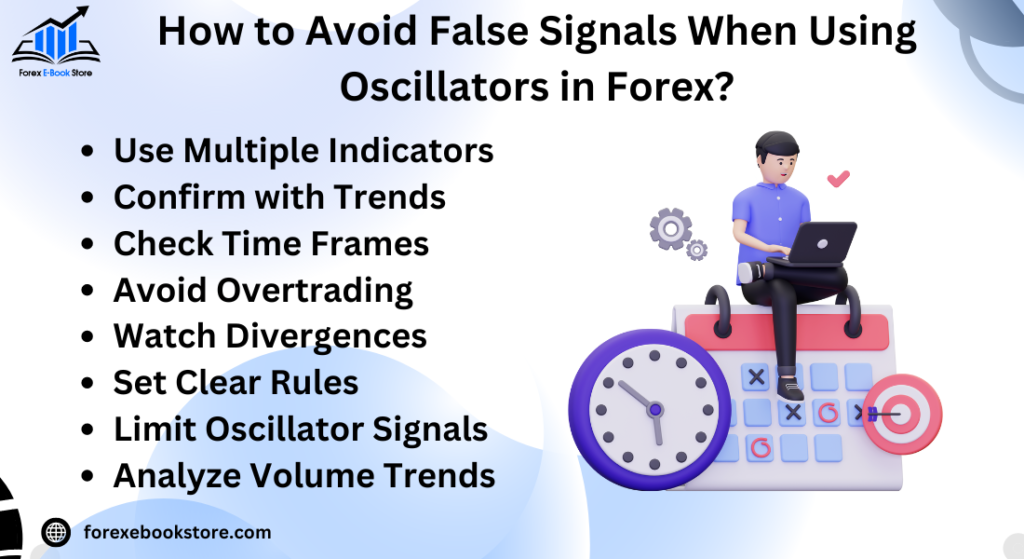
Avoiding false signals is crucial for traders using oscillators in Forex markets. One effective method is to combine oscillators with other technical indicators. For example, traders can use a moving average to confirm the trend direction before relying on an oscillator’s signal. If an oscillator like the Stochastic or RSI signals that the market is overbought, confirming that the price is still above a long-term moving average can help traders avoid a premature sell.

Another approach is to focus on divergence signals. When an oscillator diverges from the price movement, it often indicates a more reliable trading signal. For instance, bullish divergence occurs when the price is making lower lows, but the oscillator is making higher lows, signaling a potential reversal. This can help traders avoid false signals that might occur when the oscillator is only reacting to short-term price noise.
Ways to Avoid False Signals with Oscillators:
- Combine with other indicators: Use moving averages or trend lines to confirm oscillator signals.
- Look for divergence: Pay attention to bullish or bearish divergence for more reliable signals.
- Filter by trend direction: Ensure the oscillator’s signals align with the broader market trend.
What Timeframes Work Best for Oscillators in Forex Trading?
Choosing the right timeframe is essential when using oscillators in Forex trading. Oscillators such as the RSI, MACD, and Stochastic can be used across multiple timeframes, but their effectiveness depends on the trader’s strategy. For day traders and scalpers, short-term timeframes like the 5-minute or 15-minute charts are commonly used. These timeframes allow for quick entries and exits, capitalizing on short-lived market movements.
For swing traders or long-term investors, oscillators are typically applied to longer timeframes, such as the 4-hour or daily charts. These timeframes help identify more significant price trends and avoid the noise that can occur on shorter timeframes. The choice of timeframe should align with the trader’s overall strategy, as oscillators tend to produce more reliable signals when used consistently within the appropriate timeframe for the trading style.
Best Timeframes for Using Oscillators:
- 5-minute or 15-minute charts: Ideal for short-term traders and scalpers.
- 4-hour or daily charts: Better suited for swing traders and long-term investors.
- Align with strategy: Choose timeframes that complement your trading approach.
How Do You Interpret Divergence in Oscillators for Forex Trades?
Divergence in oscillators is a powerful signal in Forex trading that indicates a potential trend reversal. Divergence occurs when the price of a currency pair is moving in one direction, while the oscillator is moving in the opposite direction. This discrepancy between the price action and the oscillator suggests that the current trend may be losing strength and could reverse soon.
There are two types of divergence: bullish divergence and bearish divergence. Bullish divergence happens when the price makes lower lows, but the oscillator (such as the RSI or MACD) makes higher lows, indicating that selling pressure is weakening, and a price rebound might occur. Bearish divergence occurs when the price makes higher highs, but the oscillator makes lower highs, suggesting that buying momentum is fading, and the price may start to fall. These signals are often used by traders to time market entries and exits more effectively.
How to Interpret Divergence in Oscillators:
- Bullish divergence: Price makes lower lows, oscillator makes higher lows – indicates potential upward reversal.
- Bearish divergence: Price makes higher highs, oscillator makes lower highs – signals potential downward reversal.
- Use with caution: Confirm divergence with other indicators or market conditions to avoid false signals.
What Tools Can You Use to Analyze Oscillators in Forex Trading Platforms?
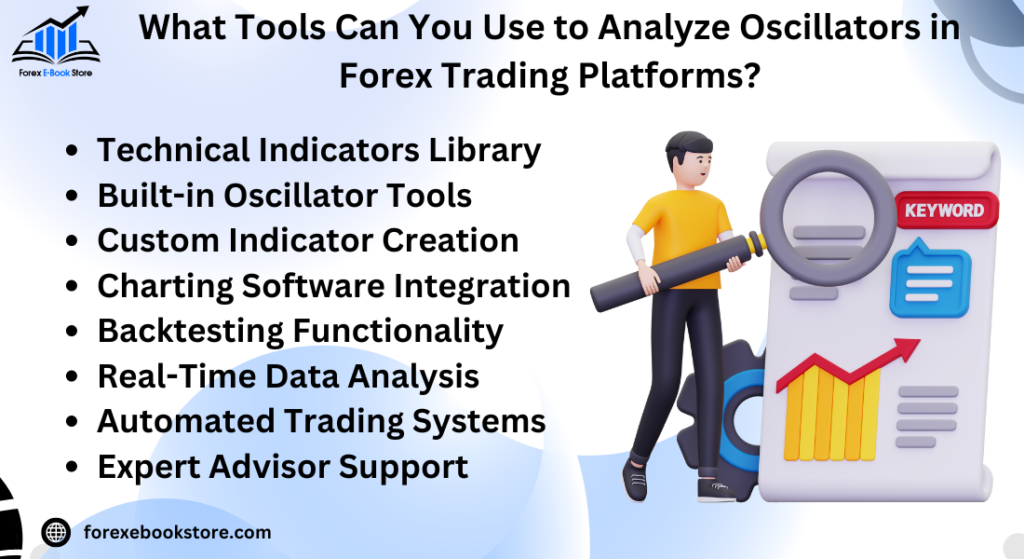
There are numerous Forex trading platforms that offer built-in tools to help traders analyze oscillators effectively. Popular platforms like MetaTrader 4 (MT4), MetaTrader 5 (MT5), and TradingView provide powerful charting tools and indicators, including it such as the RSI, MACD, and Stochastic Oscillator. These platforms allow traders to customize the oscillator settings, adjust timeframes, and overlay other technical indicators for a more comprehensive analysis.

Additionally, some platforms, like ThinkorSwim and cTrader, offer advanced tools for backtesting strategies that involve oscillators. These tools help traders assess the effectiveness of their oscillator-based strategies by simulating past trades and analyzing historical performance. Moreover, trading platforms often provide educational resources and tutorials that guide traders on how to apply it and other indicators in real-market conditions.
Best Tools for Analyzing Oscillators:
- MetaTrader 4 (MT4)/MetaTrader 5 (MT5): Offer customizable oscillators and comprehensive charting.
- TradingView: Great for visual analysis and charting, with robust oscillator tools.
- ThinkorSwim/cTrader: Useful for backtesting strategies and evaluating historical performance.
How to Incorporate Oscillators into a Comprehensive Forex Strategy?
Incorporating oscillators into a comprehensive Forex strategy requires combining them with other indicators and techniques to maximize their effectiveness. Oscillators, such as the RSI and MACD, can be used to identify overbought and oversold conditions or momentum shifts, but they are most powerful when used alongside trend-following indicators like moving averages or Bollinger Bands. For example, a trader might look for a bullish RSI signal while the price is near a long-term moving average support, confirming the potential for a rebound.
Another key to using oscillators effectively is adjusting the timeframes based on the overall strategy. For short-term traders, oscillators like the Stochastic Oscillator work well on shorter timeframes (e.g., 5-minute or 15-minute charts) to capture quick price movements. For long-term traders, oscillators should be used on higher timeframes, such as daily or weekly charts, to confirm longer trends. Combining it with risk management techniques, such as stop-loss orders, can further enhance the strategy by reducing potential losses during false signals.
Incorporating Oscillators into a Forex Strategy:
- Combine with other indicators: Use oscillators with moving averages or Bollinger Bands for confirmation.
- Adjust timeframes: Short-term traders can use this on lower timeframes; long-term traders should focus on higher timeframes.
- Use risk management: Incorporate stop-loss orders to minimize risks from false signals.
Conclusion
In conclusion, using oscillators in Forex trading can provide valuable insights into market momentum, overbought and oversold conditions, and potential trend reversals. Tools like the RSI, Stochastic Oscillator, and MACD allow traders to make more informed decisions by identifying key price points for entry and exit. When combined with other technical indicators, it becomes even more powerful in creating a well-rounded trading strategy that balances risk and reward.
Similarly, understanding what is a moving average complements the use of oscillators by helping traders smooth price data and follow long-term trends. While moving averages help in identifying the overall direction of the market, it can fine-tune the timing of trades by spotting short-term market fluctuations. Together, these tools form the backbone of technical analysis in Forex, providing a comprehensive approach to navigating market volatility and making smarter trades.


