Understanding Support and Resistance is a fundamental concept in technical analysis that helps traders identify key levels where the price of an asset tends to reverse or consolidate. These levels serve as psychological barriers for traders, making them critical when deciding entry and exit points in the market. By understanding support and resistance, traders can anticipate price movements, manage risk more effectively, and increase the likelihood of profitable trades.
At its core, support represents a price level where a downtrend can pause due to a concentration of demand, while resistance is a price point where an uptrend stalls as a result of increased selling pressure. Learning to spot these levels requires a combination of technical tools, market psychology, and experience. Incorporating trendlines, moving averages, and Fibonacci retracements can further refine one’s analysis of support and resistance levels.
Table of Contents
How do traders identify support and resistance zones?
Identifying support and resistance zones is crucial for making informed trading decisions. Traders use several techniques to locate these key levels, combining historical data and technical tools. One of the most straightforward methods is to examine past price action. By observing where price previously reversed or consolidated, traders can mark these areas as potential future support or resistance levels.
Key tools for identifying support and resistance include:
- Horizontal lines: These are drawn at points where price has repeatedly reversed, marking strong psychological levels.
- Trendlines: When price moves consistently in a direction, a diagonal trendline helps identify where the price could bounce off, acting as dynamic support or resistance.
- Moving averages: As a moving average glides with the price, it can act as dynamic support during uptrends or resistance during downtrends.
Why are support and resistance critical for technical analysis?
Support and resistance levels are the backbone of technical analysis because they reveal crucial price points where buying or selling interest is significant. These levels often indicate a market’s turning point, allowing traders to anticipate potential price reversals or breakouts. Understanding support and resistance helps traders recognize where price may stall, giving them the opportunity to adjust their strategies accordingly.
Support and resistance also reflect the market’s sentiment. For example, when an asset repeatedly fails to break through a resistance level, it shows that sellers are in control. Conversely, if a price consistently holds at a support level, it indicates strong buying pressure. Recognizing these patterns:
- Informs trade entries and exits, allowing traders to set stop-loss and take-profit levels effectively.
- Enhances risk management by helping traders understand where the market is likely to shift direction.
What factors influence the strength of support and resistance levels?
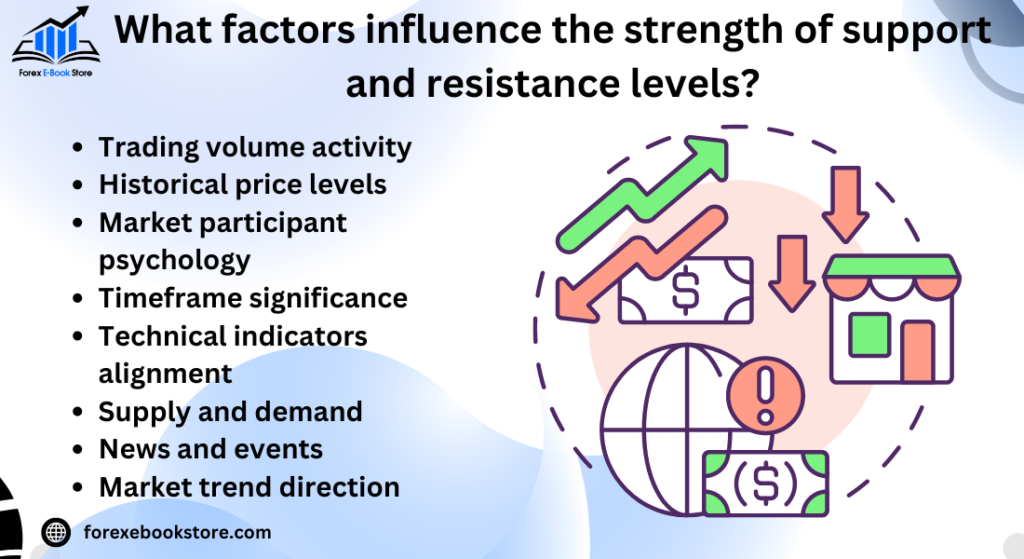
Not all support and resistance levels are equal. Several factors contribute to the strength and reliability of these levels. The more times a price touches a support or resistance level without breaking through, the stronger that level becomes. Volume also plays a crucial role—when price touches these levels on high volume, it adds credibility, indicating that many traders recognize the importance of that area.

Some of the key factors influencing the strength of support and resistance include:
- Volume of trades: Higher volume around these levels signals stronger support or resistance.
- Time frame: Support and resistance on longer timeframes (daily, weekly) are typically more reliable than those on shorter timeframes.
- Market sentiment: The overall mood of traders, whether bullish or bearish, can reinforce the strength of these levels, especially when combined with significant news or economic events.
What is the psychology behind support and resistance?
The psychology behind support and resistance is rooted in the collective behavior of market participants. Support and resistance levels represent points where traders have historically bought or sold, creating psychological barriers that are difficult to break. For example, when a price approaches a support level, buyers often see this as a good entry point, believing that the price will rise again. On the other hand, sellers typically gather at resistance levels, thinking the price will fall from that point.
This behavior creates self-fulfilling prophecies, where:
- Buyers flock to support levels, reinforcing the idea that the price will bounce back.
- Sellers dominate at resistance levels, making it difficult for the price to break through.
These levels often reflect market emotions such as fear and greed. Traders may panic and sell if the price breaks a support level, while a break above resistance can trigger a surge of buying as traders fear missing out on a breakout.
How does volume affect support and resistance?
Volume is a critical factor when analyzing support and resistance because it indicates the strength of these levels. High volume at a support or resistance level suggests a greater commitment from traders, making it harder for the price to break through. Conversely, weak volume indicates that the level may not hold, leading to a potential price breakout or breakdown.
When analyzing volume in relation to support and resistance, consider:
- High volume near support: This often suggests strong buying interest, reinforcing the support level.
- High volume near resistance: Indicates significant selling pressure, making it harder for the price to break through.
Additionally, volume spikes often accompany breakouts, signaling a shift in market sentiment. If a price breaks through resistance on high volume, it suggests that the resistance level has been overcome by new demand, potentially signaling the start of a strong upward trend.
What tools can traders use to plot support and resistance levels?
To accurately plot support and resistance levels, traders rely on a variety of tools and indicators. These tools help traders visualize where price levels are likely to act as barriers based on historical price action and technical data. Some of the most commonly used tools include:
- Pivot points: These are calculated based on the previous period’s high, low, and close prices, and they help identify key support and resistance levels for the upcoming period.
- Fibonacci retracement: This tool is based on the Fibonacci sequence and helps identify potential support and resistance levels by measuring the degree of retracement in a trend.
- Moving averages: Traders use different moving averages (e.g., 50-day, 200-day) to plot dynamic support and resistance levels. A moving average can act as support in an uptrend or resistance in a downtrend.
How do moving averages interact with support and resistance?
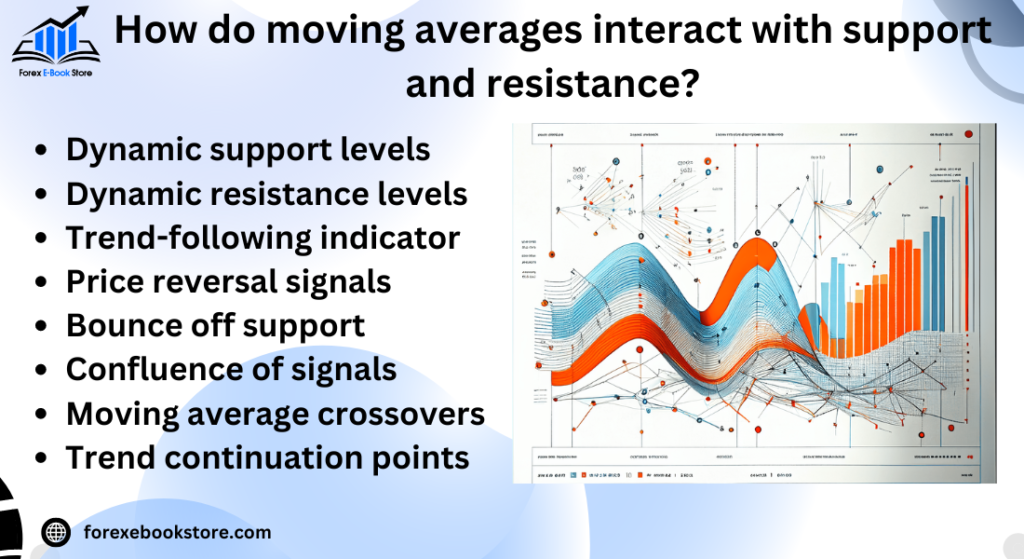
Moving averages (MAs) are dynamic tools that traders often use to identify support and resistance levels. Unlike static horizontal lines, moving averages continuously change based on price movements over a specified period, creating evolving levels of support and resistance. Common moving averages include the 50-day and 200-day MAs, which are frequently used by traders to gauge market trends and potential reversals.

- Support in uptrends: In an uptrend, the price often bounces off a moving average, using it as a support level. Traders look for opportunities to enter long positions when the price retraces to the moving average.
- Resistance in downtrends: In a downtrend, the moving average can act as resistance, where the price struggles to break above it. Traders may look to short the market when the price rallies towards the moving average.
When the price crosses above or below significant moving averages, it can signal shifts in market sentiment:
- Crossing above the moving average: This can indicate the price breaking a previous resistance level, signaling a potential uptrend.
- Crossing below the moving average: This can indicate the price breaking a support level, often signaling further downside movement.
What role do trendlines play in defining support and resistance?
Trendlines are one of the simplest yet most powerful tools for defining dynamic support and resistance levels. Unlike horizontal support and resistance levels, trendlines connect a series of price points over time, creating a sloping line that reflects the market’s general direction. These lines can be drawn across price highs or lows and help traders identify the underlying trend of the market.
- Uptrend support: In an uptrend, trendlines are drawn connecting a series of higher lows, which form a sloping support line. Traders will often buy when the price approaches this trendline, expecting the uptrend to continue.
- Downtrend resistance: In a downtrend, trendlines are drawn connecting a series of lower highs, which create a resistance level. Traders may enter short positions when the price rallies toward this trendline, expecting it to hold as resistance.
Trendlines can provide valuable insights into the strength of a trend:
- Steeper trendlines often indicate stronger trends, but they may be more prone to breakouts.
- Flatter trendlines suggest a weaker trend, but they can offer more reliable support or resistance.
How can you use support and resistance in different timeframes?
Support and resistance levels can vary significantly depending on the timeframe being analyzed. Long-term traders tend to focus on higher timeframes like the daily or weekly charts, while short-term traders might use minute or hourly charts to make more frequent trades. The timeframe used will affect both the reliability and significance of the support and resistance levels.
- Higher timeframes (daily/weekly): Support and resistance levels on higher timeframes are generally stronger and more reliable. These levels often represent key market turning points and can provide greater context for long-term trend analysis.
- Lower timeframes (hourly/minute): Day traders often use lower timeframes to identify intraday support and resistance levels. While these levels may be less reliable than those on higher timeframes, they can provide opportunities for short-term trades.
Using multiple timeframes can enhance trading strategies:
- Top-down analysis: Traders often start by identifying key support and resistance levels on higher timeframes and then zoom into lower timeframes to refine their entries and exits.
- Confluence: When support or resistance levels align across multiple timeframes, it strengthens the probability of the level holding, offering more confidence in trading decisions.
What are the common mistakes traders make with support and resistance?
Trading with support and resistance levels can be highly effective, but many traders fall into common pitfalls that reduce their profitability. One of the most frequent mistakes is failing to wait for confirmation. Instead of waiting for the price to clearly react to a support or resistance level, traders often anticipate the move, entering trades prematurely, which leads to false breakouts.
- Ignoring market context: Traders sometimes focus solely on support and resistance levels without considering the broader market context, such as trends, volume, or major news events. This can lead to poor trade decisions, as support and resistance levels are not static and can shift based on changing market dynamics.
- Over-reliance on a single tool: Another common mistake is depending too much on a single method for identifying support and resistance (e.g., only using moving averages or horizontal lines). A more robust approach involves combining multiple tools and indicators to reinforce key levels.
To avoid these mistakes:
- Always wait for price confirmation before entering a trade.
- Consider the overall market conditions, including trends and volume, before making decisions.
- Use a combination of technical tools such as trendlines, moving averages, and Fibonacci retracements for stronger signals.
How do breakouts and fakeouts relate to support and resistance levels?
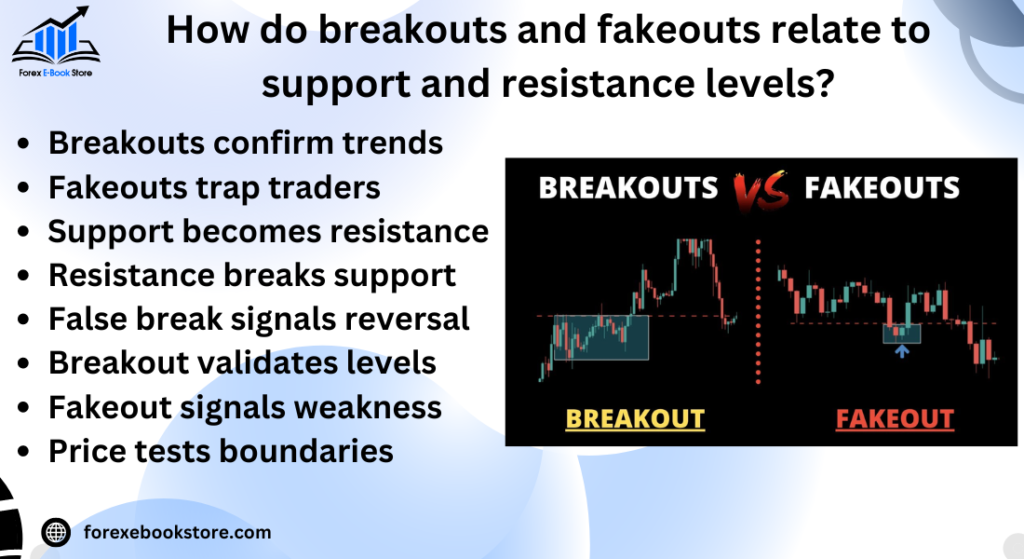
Breakouts and fakeouts are closely related to support and resistance, and understanding these phenomena is crucial for successful trading. A breakout occurs when the price moves beyond a well-established support or resistance level, signaling a potential trend continuation or reversal. However, not every breakout is legitimate—fakeouts happen when the price temporarily moves past the level but then quickly reverses, trapping traders who anticipated a sustained move.

- Breakouts: When a resistance level is broken with strong volume and momentum, it often indicates the start of a new uptrend. Similarly, breaking through a support level can signal a further decline. Breakouts are most reliable when accompanied by high volume, which confirms the commitment of market participants.
- Fakeouts: Fakeouts occur when a breakout appears to happen but lacks volume or follow-through. This can result in a quick price reversal, often causing traders to lose money if they entered the market too early.
To trade breakouts and avoid fakeouts:
- Look for increased volume during a breakout, which confirms that the move has strength behind it.
- Use stop-loss orders below the breakout level to protect against fakeouts.
- Combine breakout strategies with other indicators, such as RSI or MACD, to verify the move’s validity.
What are dynamic vs. static support and resistance levels?
Support and resistance levels can be categorized as either dynamic or static. Static levels are fixed and do not change, often represented by horizontal lines drawn at historical price levels. These levels, such as those created by previous highs and lows, remain constant regardless of how the market evolves.
- Static levels: These are key price points that have historically acted as support or resistance. Traders often use horizontal lines to mark these levels, knowing that the price has a high probability of reacting when it approaches them again.
In contrast, dynamic support and resistance levels change with the market and are typically determined by moving averages or trendlines. Dynamic levels adjust as new data emerges, providing more real-time analysis of where the price may encounter support or resistance in a trending market.
- Dynamic levels: Moving averages, such as the 50-day or 200-day moving average, provide support and resistance that evolve with price action. Trendlines drawn along swing highs or lows also represent dynamic support and resistance that traders use to predict future price movements.
To utilize both effectively:
- Use static levels for identifying long-term, key price points where reversals are likely.
- Use dynamic levels to track real-time trends and react to evolving market conditions.
How do Fibonacci retracements complement support and resistance analysis?
Fibonacci retracements are a popular technical analysis tool that complements support and resistance levels by helping traders identify potential reversal points. Based on the Fibonacci sequence, these retracements calculate specific price levels where a retracement or pullback is likely to occur within a trend. Key Fibonacci levels include 23.6%, 38.2%, 50%, 61.8%, and 78.6%, with the 38.2% and 61.8% levels being the most closely watched.
- Support in uptrends: Traders often use Fibonacci retracement levels to identify where the price may find support during a pullback in an overall uptrend. For instance, if the price retraces to the 61.8% level and bounces, it may indicate strong support.
- Resistance in downtrends: Similarly, during a downtrend, Fibonacci levels can act as resistance points where the price is likely to reverse after a short-term rally.
Fibonacci retracements are most effective when combined with other support and resistance tools:
- Look for confluence where Fibonacci levels overlap with existing support and resistance levels.
- Use Fibonacci levels in conjunction with trendlines and moving averages to increase the reliability of your analysis.
- Ensure volume supports the move when price reaches a significant Fibonacci level.
Can support and resistance levels predict future price movements?
While support and resistance levels offer valuable insights, they should not be viewed as precise predictors of future price movements. Instead, these levels serve as guidelines where price action is likely to react, but external factors such as market sentiment, news events, and economic data can cause unexpected shifts. However, by analyzing these levels in combination with other tools, traders can improve their odds of making more accurate predictions.
- Historical price reactions: Support and resistance levels are drawn based on previous price reactions, and while these levels often hold, the market can break through them, especially during periods of high volatility.
- Confirmation through other indicators: Support and resistance become more predictive when combined with indicators like volume, momentum oscillators (e.g., RSI, MACD), and candlestick patterns. These can offer confirmation on whether a level is likely to hold or break.
To enhance predictive power:
- Combine support and resistance levels with fundamental analysis, particularly in highly reactive markets (e.g., around earnings reports or central bank meetings).
- Use multiple timeframes to identify stronger levels of support and resistance.
How does support become resistance and vice versa?
One of the core concepts in technical analysis is the idea that support can turn into resistance and vice versa, a phenomenon known as role reversal. This occurs when the price breaks through a significant level, and what was once an area of support becomes an area of resistance, or a resistance level becomes support after being breached.
- Support becomes resistance: After the price falls below a key support level, that level may act as resistance if the price attempts to rise again. Traders look for short-selling opportunities when the price rallies back to this former support, anticipating it will hold as resistance.
- Resistance becomes support: Similarly, when the price breaks above a resistance level, traders often expect this level to provide support during a future pullback. This gives traders an opportunity to buy in anticipation of the level holding as new support.
The concept of role reversal is reinforced by trader psychology:
- Psychological impact: Traders remember these key levels and adjust their strategies accordingly, often causing the same price levels to act as barriers repeatedly.
- Confirmation needed: Wait for price action confirmation before assuming a former support or resistance level has flipped.
How do professional traders manage risk using support and resistance?
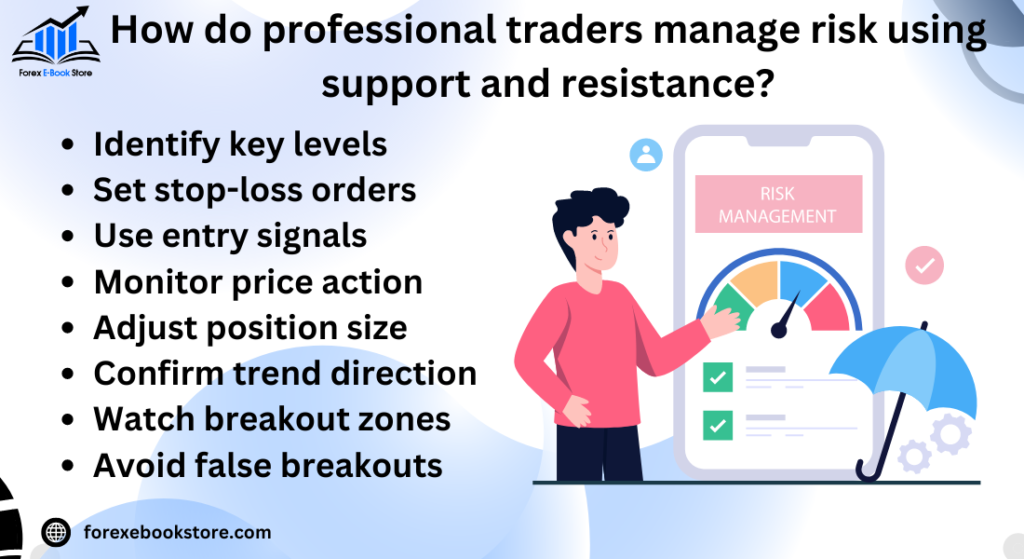
Professional traders use support and resistance levels not only to find entry and exit points but also to manage risk effectively. These levels provide natural places to place stop-loss and take-profit orders, helping traders control potential losses and lock in profits.

- Placing stop-loss orders: Traders typically place stop-loss orders just below a key support level when they are in a long position. This strategy ensures that if the price breaks below support, indicating a potential trend reversal, the trade automatically closes to limit losses.
- Setting take-profit levels: Traders set take-profit orders at or near resistance levels. This allows them to secure gains if the price struggles to break through resistance, especially if they anticipate a reversal.
Key strategies for managing risk:
- Use stop-loss orders just below support or above resistance, depending on your trade direction.
- Position sizing: Calculate the appropriate position size based on the distance between the entry price and the support or resistance level, ensuring that the potential loss fits within your overall risk management strategy.
- Trailing stops: Some professional traders use trailing stops, which move along with the price to lock in profits while minimizing downside risk.
What are the advanced strategies for trading with support and resistance?
While basic support and resistance trading strategies are widely used, advanced traders employ more sophisticated techniques to maximize their success. One such strategy is support and resistance zones rather than single lines. Instead of focusing on precise levels, advanced traders look at zones where the price might reverse, allowing for more flexibility in their trades.
- Using multiple indicators: Advanced traders often combine support and resistance with additional tools such as Bollinger Bands, RSI, or MACD to confirm potential reversals and increase the probability of successful trades.
- Breakout trading with volume confirmation: Instead of simply trading a breakout above resistance or below support, advanced traders wait for confirmation in the form of higher volume. This helps ensure that the breakout is legitimate and not a fakeout.
Advanced strategies for support and resistance:
- Support and resistance zones: Look at broader price areas rather than pinpoint levels to account for market noise and volatility.
- Confluence: Use multiple technical indicators that align with support and resistance to increase the reliability of trade setups.
- Fade breakouts: In some cases, advanced traders trade against breakouts, betting on a reversal if the breakout shows signs of weakness.
How does time impact the strength of support and resistance levels?
Time is a critical factor in determining the strength of supports and resistance levels. Levels that have been tested over longer periods tend to be more reliable than those that have only recently formed. Traders often place greater weight on these levels, as they indicate stronger psychological importance and market consensus.
- Long-term vs. short-term levels: Support and resistance levels on weekly or monthly charts are considered stronger than those on shorter timeframes like hourly or daily charts. These levels often represent key market turning points, where the price has reacted multiple times in the past.
- Multiple touches: The more times a price tests a support or resistance level over time, the stronger that level becomes. Each test reinforces the psychological significance of the level, making it more likely to hold in future price action.
To use time to your advantage:
- Focus on higher timeframe levels for stronger support and resistance, especially when planning longer-term trades.
- Track how often a level has been tested without being broken, as repeated tests can indicate that the level is becoming stronger.
Conclusion
In conclusion, understanding support and resistance is fundamental to mastering technical analysis in trading. These key levels allow traders to anticipate potential price movements, manage risk effectively, and make more informed trading decisions. By combining support and resistance analysis with other tools such as moving averages, Fibonacci retracements, and volume indicators, traders can improve their accuracy and profitability. Recognizing how these levels shift and evolve over time is essential for both short-term and long-term trading strategies.
Additionally, understanding how to use trend lines is a natural extension of support and resistance analysis. Trend lines provide dynamic support and resistance levels that evolve with the market’s direction. By incorporating trend lines into your strategy, you can better identify trends and anticipate when the price might reverse or continue. This combined approach strengthens your overall technical analysis, offering a clearer picture of the market’s potential movements.


